Orbify changelog
REDD+ Project Planning Template

We’re excited to announce the launch of our new REDD+ project template, built on the VCM methodology VM0048: Reducing Emissions from Deforestation and Forest Degradation (v1.0) and incorporating Module VMD0055: Estimation of Emission Reductions From Avoiding Unplanned Deforestation.
The Credits Assessment feature in this template provides an analysis based on data approximating the official Activity Data and Risk Maps.
While not all jurisdictions are currently supported under this methodology, we are actively updating and expanding our datasets to include new areas. Unsupported jurisdictions may have limited functionality for certain components, but we’re committed to gradually adding coverage to ensure comprehensive support.
Improved Commodity Plot identification
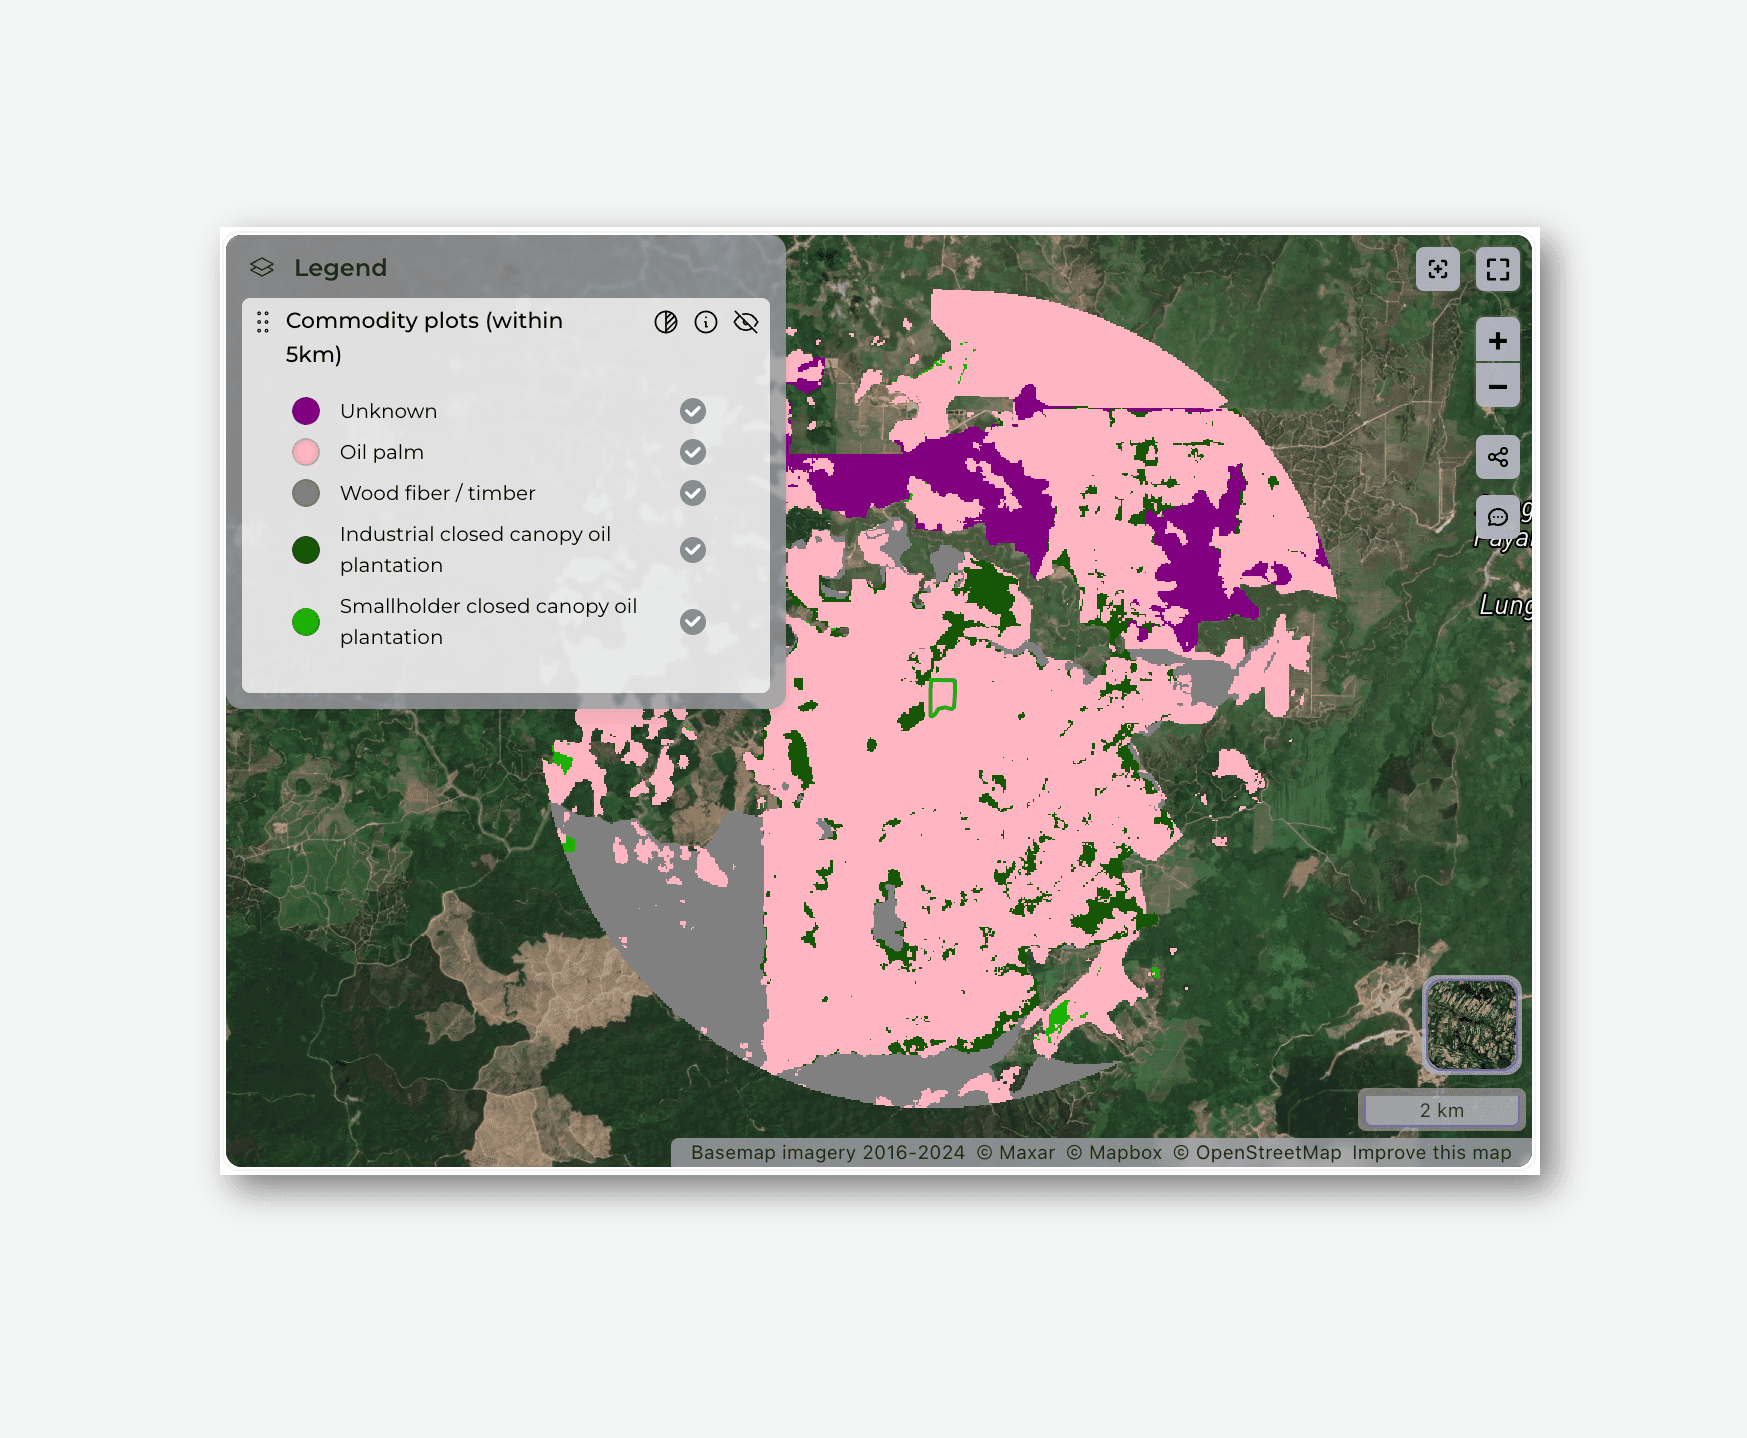
After a thorough review, we’ve upgraded our commodity plot identification database by additionally integrating the Spatial Database of Planted Trees (SDPT) version 2.0, replacing the previous version 1.0. This updated dataset offers coverage of over 260 million hectares of planted forests worldwide, significantly enhancing both precision and geographic scope.
With this integration, we’ve also updated EUDR compliance-related components, ensuring more accurate and reliable screening results. These improvements further strengthen our ability to provide precise assessments and maintain compliance with evolving regulatory standards.
Please note that this update may lead to changes in the compliance status of some plots. The improved refinement of the data has resulted in greater granularity and higher-resolution boundaries, which could affect how plots are assessed for compliance.
Introducing Orbify PlotShare
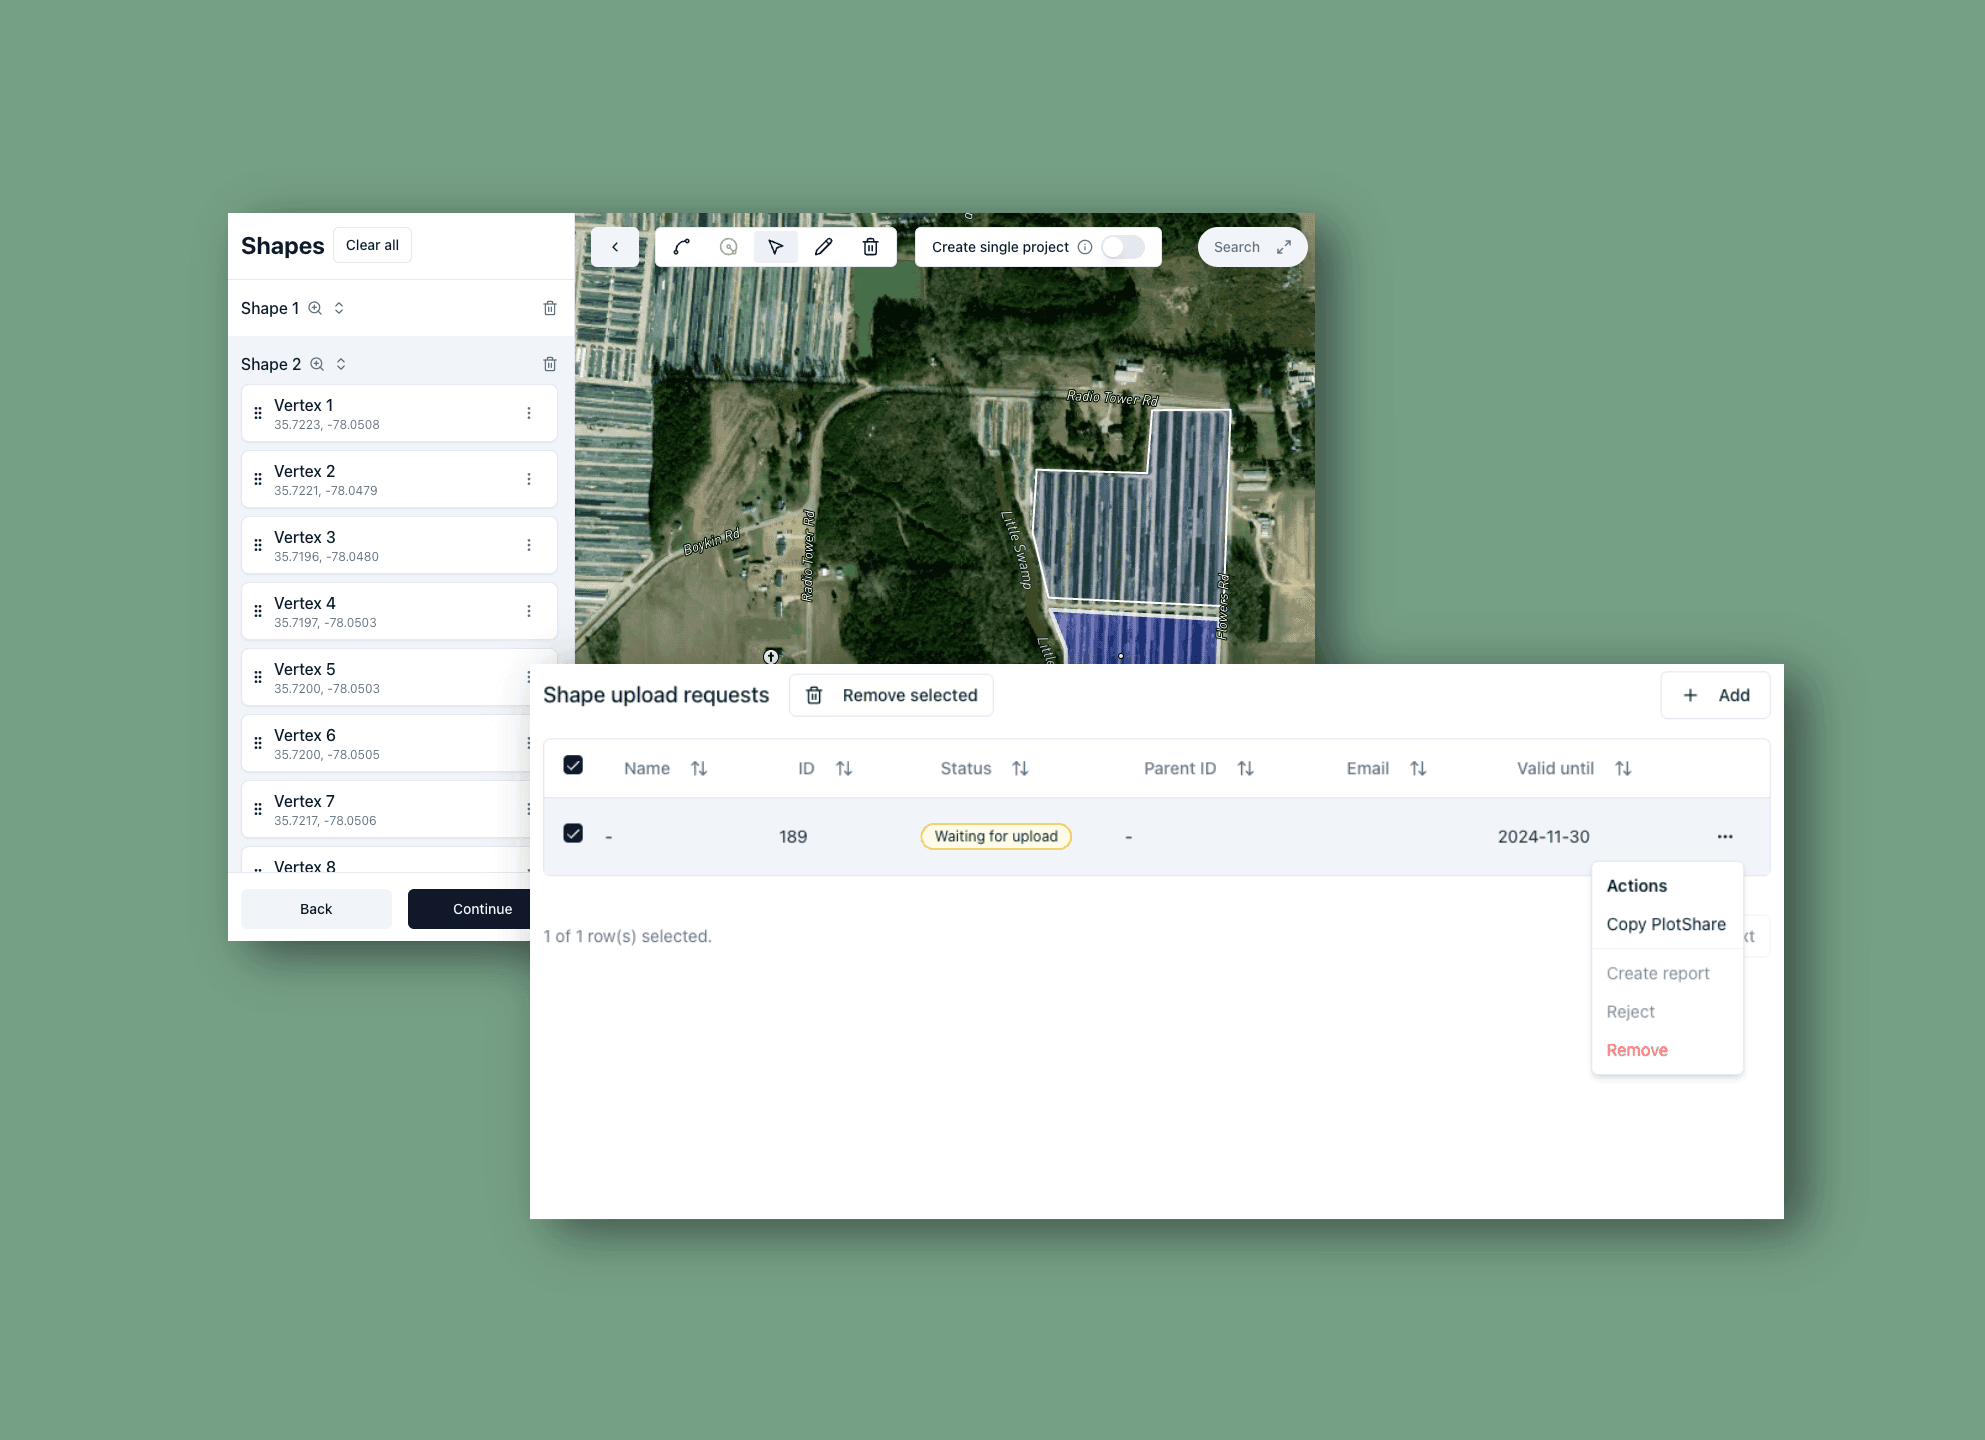
We’re excited to introduce PlotShare, a new feature that lets Orbify Platform users streamline project area creation by sharing responsibility directly with plot owners or managers.
PlotShare reduces the back-and-forth communication and potential errors in capturing plot boundaries, making the process easier and faster for all parties involved.
With PlotShare, platform users can create a unique link that allows plot owners to open the project area creator, where they can easily upload a shape definition file or draw the project area on a map. Once the plot is defined, users can:
Review the area and approve it to generate reports
Edit the shape if adjustments are needed
Request Corrections from the plot owner if issues arise
We are also introducing CSV support to make the experience even more accessible, especially for users unfamiliar with GIS technology. Plot owners can now create shapes directly from CSV files, eliminating the need for complex spatial data files.
Additionally, editing is straightforward with a visual map editor and an easy-to-use geographic coordinates editor to refine shape vertices.
Project area creator redesign
Together with PlotShare, we’ve rolled out a complete redesign of the project creator, making project area creation smoother, faster, and more intuitive. With a fresh, modern interface and a suite of new tools, users can now define project areas with precision and ease.
This update brings powerful drawing tools that support the creation of complex shapes, along with intuitive shape and vertex editors for easy adjustments. You can instantly measure defined areas to support compliance, planning, and other project needs, all while keeping track of account limits in real-time for uninterrupted project creation.
Improvements & fixes
Return calculated areas (hectares) when performing Historic assessment for ARR
Fix problems when generating the annual precipitation chart
Improve parsing of complex GeoJSON files
Redesign the Biodiversity Hotspots visualisation
Fix performance issues when calculating fire risk for small AOI
Increase coverage for the Common Practice ARR component
Prevent report creation for unsupported date ranges (pre-2000)
Improve performance of chart values calculation
Introducing Reports Archive
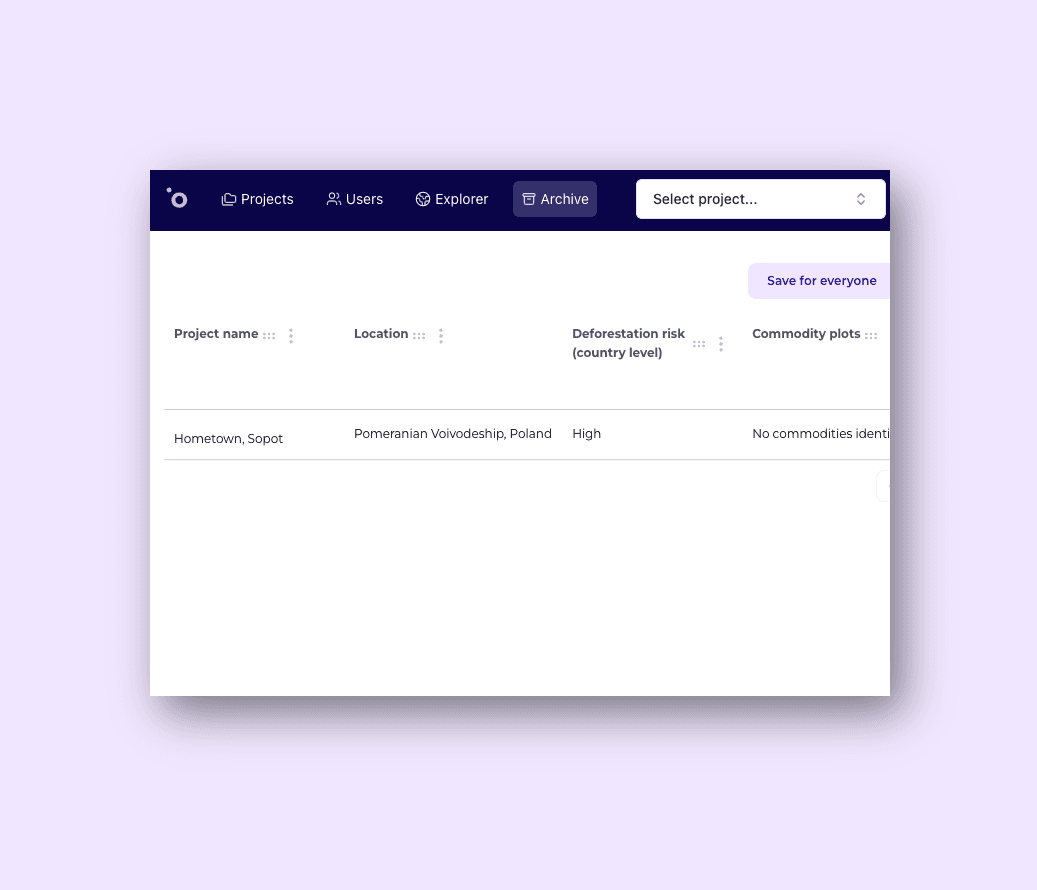
We've introduced Reports Archive, designed to streamline report management and enhance user experience. With this feature, users can archive reports they wish to retain without occupying their active report quota - meaning there's no need to delete valuable data to stay within usage limits.
Key features of the Archive:
Archiving instead of Deletion - users can archive reports, keeping them inactive yet accessible for later restoration whenever needed
Preview for Archived Reports - while archived, reports are still listed in the archive with key results available for preview
API Access - the Archive is fully accessible and manageable via the API, allowing for easy integration into existing workflows
This feature gives users greater flexibility and control over report management and Orbify Platform usage costs.
Improvements and bug fixes
Historic assessment of forested areas for ARR reporting has been updated with area calculation for specific categories (e.g. Forested, Unforested)
Fixed problem that prevented maptiles configured with long TTL from rendering
Improved support for areas with reduced data coverage in Common practice and Land use categories components
Forest loss by dominant driver has been updated (with coverage up to 2023)
Resolved an issue that could prevent Biodiversity Hotspots layer from returning correct results
SoilGrid SOC layer component was updated to report tonnes per hectare values
Dedicated EUDR API endpoint
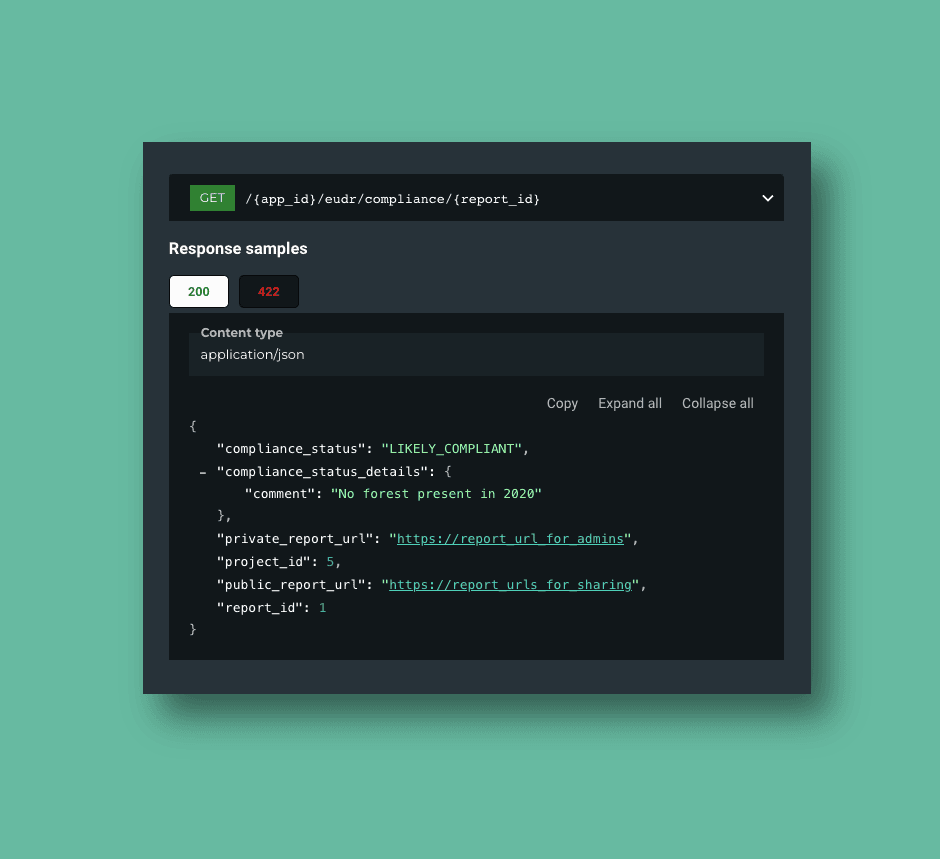
We have introduced a dedicated API designed to perform quick compliance checks for EUDR reports generated within Orbify platform. This streamlined API offers a fast and efficient way to verify plot complianace as an initial step before a complete report is fetched and analyzed.
The documentation of the endpoint is available in our API docs here.
Improvements
Forest loss by dominant driver dataset was updated to cover the temporal range up to 2023
A new type of custom component output was introduced -
computed_markdown- allowing to create custom, automatically generated text components, based on the well-known Markdown syntax
Bug fixes and improvements
Fixed a problem with report's creation date not appearing for some of the older reports
Improved performance and reliability of fire risk related components
Introduced guards to prevent accidental split of large geometries into separate reports
Introduced a dedicated caching mechanism to improve performance of the exportable report table columns
Fixed a problem with
Not founderror returned for some published reports
Bug fixes and minor improvements

Fixed EUDR component to improve the accuracy of compliance understanding by correcting result interpretation issues.
Resolved handling of large areas in tree cover loss layer component (_tree_cover_loss_by_dominant_driver_layer_develop) to improve scalability for larger AOIs.
Addressed deforestation visibility issue in the EUDR template where detected deforestation was not being displayed on the map.
Fixed calculation issues with EVI/NDVI metrics to ensure accurate vegetation index reporting.
Resolved Performance Benchmark Block malfunction in the ARR Additionality Tab, for improving workflow.
Improved handling of large areas in forest 2020 statistics component (component_known_issues_forest2020_stat) for better performance and accuracy in large datasets.
Clarified Non-Permanence Risk Percentage interpretation in ARR Additionality Tab for clearer risk assessments.
Fixed Moisture Chart to display correct values, improving data clarity and visualization.
Added no-data handling to a specific component (component_glad_tree_growth_chart_main).
Fixed annual NDVI/EVI calculation failures, ensuring uninterrupted calculation processes for the vegetattion index annual data.
Resolved pydantic issue in Terrain component, allowing smoother functionality without data validation errors.
Fixed the defrestation degradation statistic component: when no data is provided, avoiding unnecessary failures in data vizualization (perimeter_boundary_deforestation_degradation_stat error) .
Adjusted Min/Max values in the surface temperature chart component (average_surface_temperature_stat) for more accurate temperature representation.
Fixed negative value display in AGB loss by year component (component_agb_loss_by_year_chart) for more accurate data presentation.
Fixed pixel overload issue in tree_cover_loss_by_dominant_driver_layer and Forest Map Quality Screening Tool, ensuring proper visualization.
Improvements
Enhanced visibility of degraded tropical moist forest by introducing a distinct color scheme for easier identification.
Improved chart clarity by renaming the Oil Palm Plantations chart to provide more accurate context.
Restored missing thumbnails to improve component previews and enhance the overall user experience.
Support EUDR Point Coordinates
We’ve expanded our platform’s capabilities by adding support for point coordinates when creating project geometries. This enhancement brings more flexibility and precision to the user interface, allowing users to upload and process Point geometries directly.
Key features include:
Point Geometry Processing - users can now upload files with point data, which the platform processes for creating project geometries,
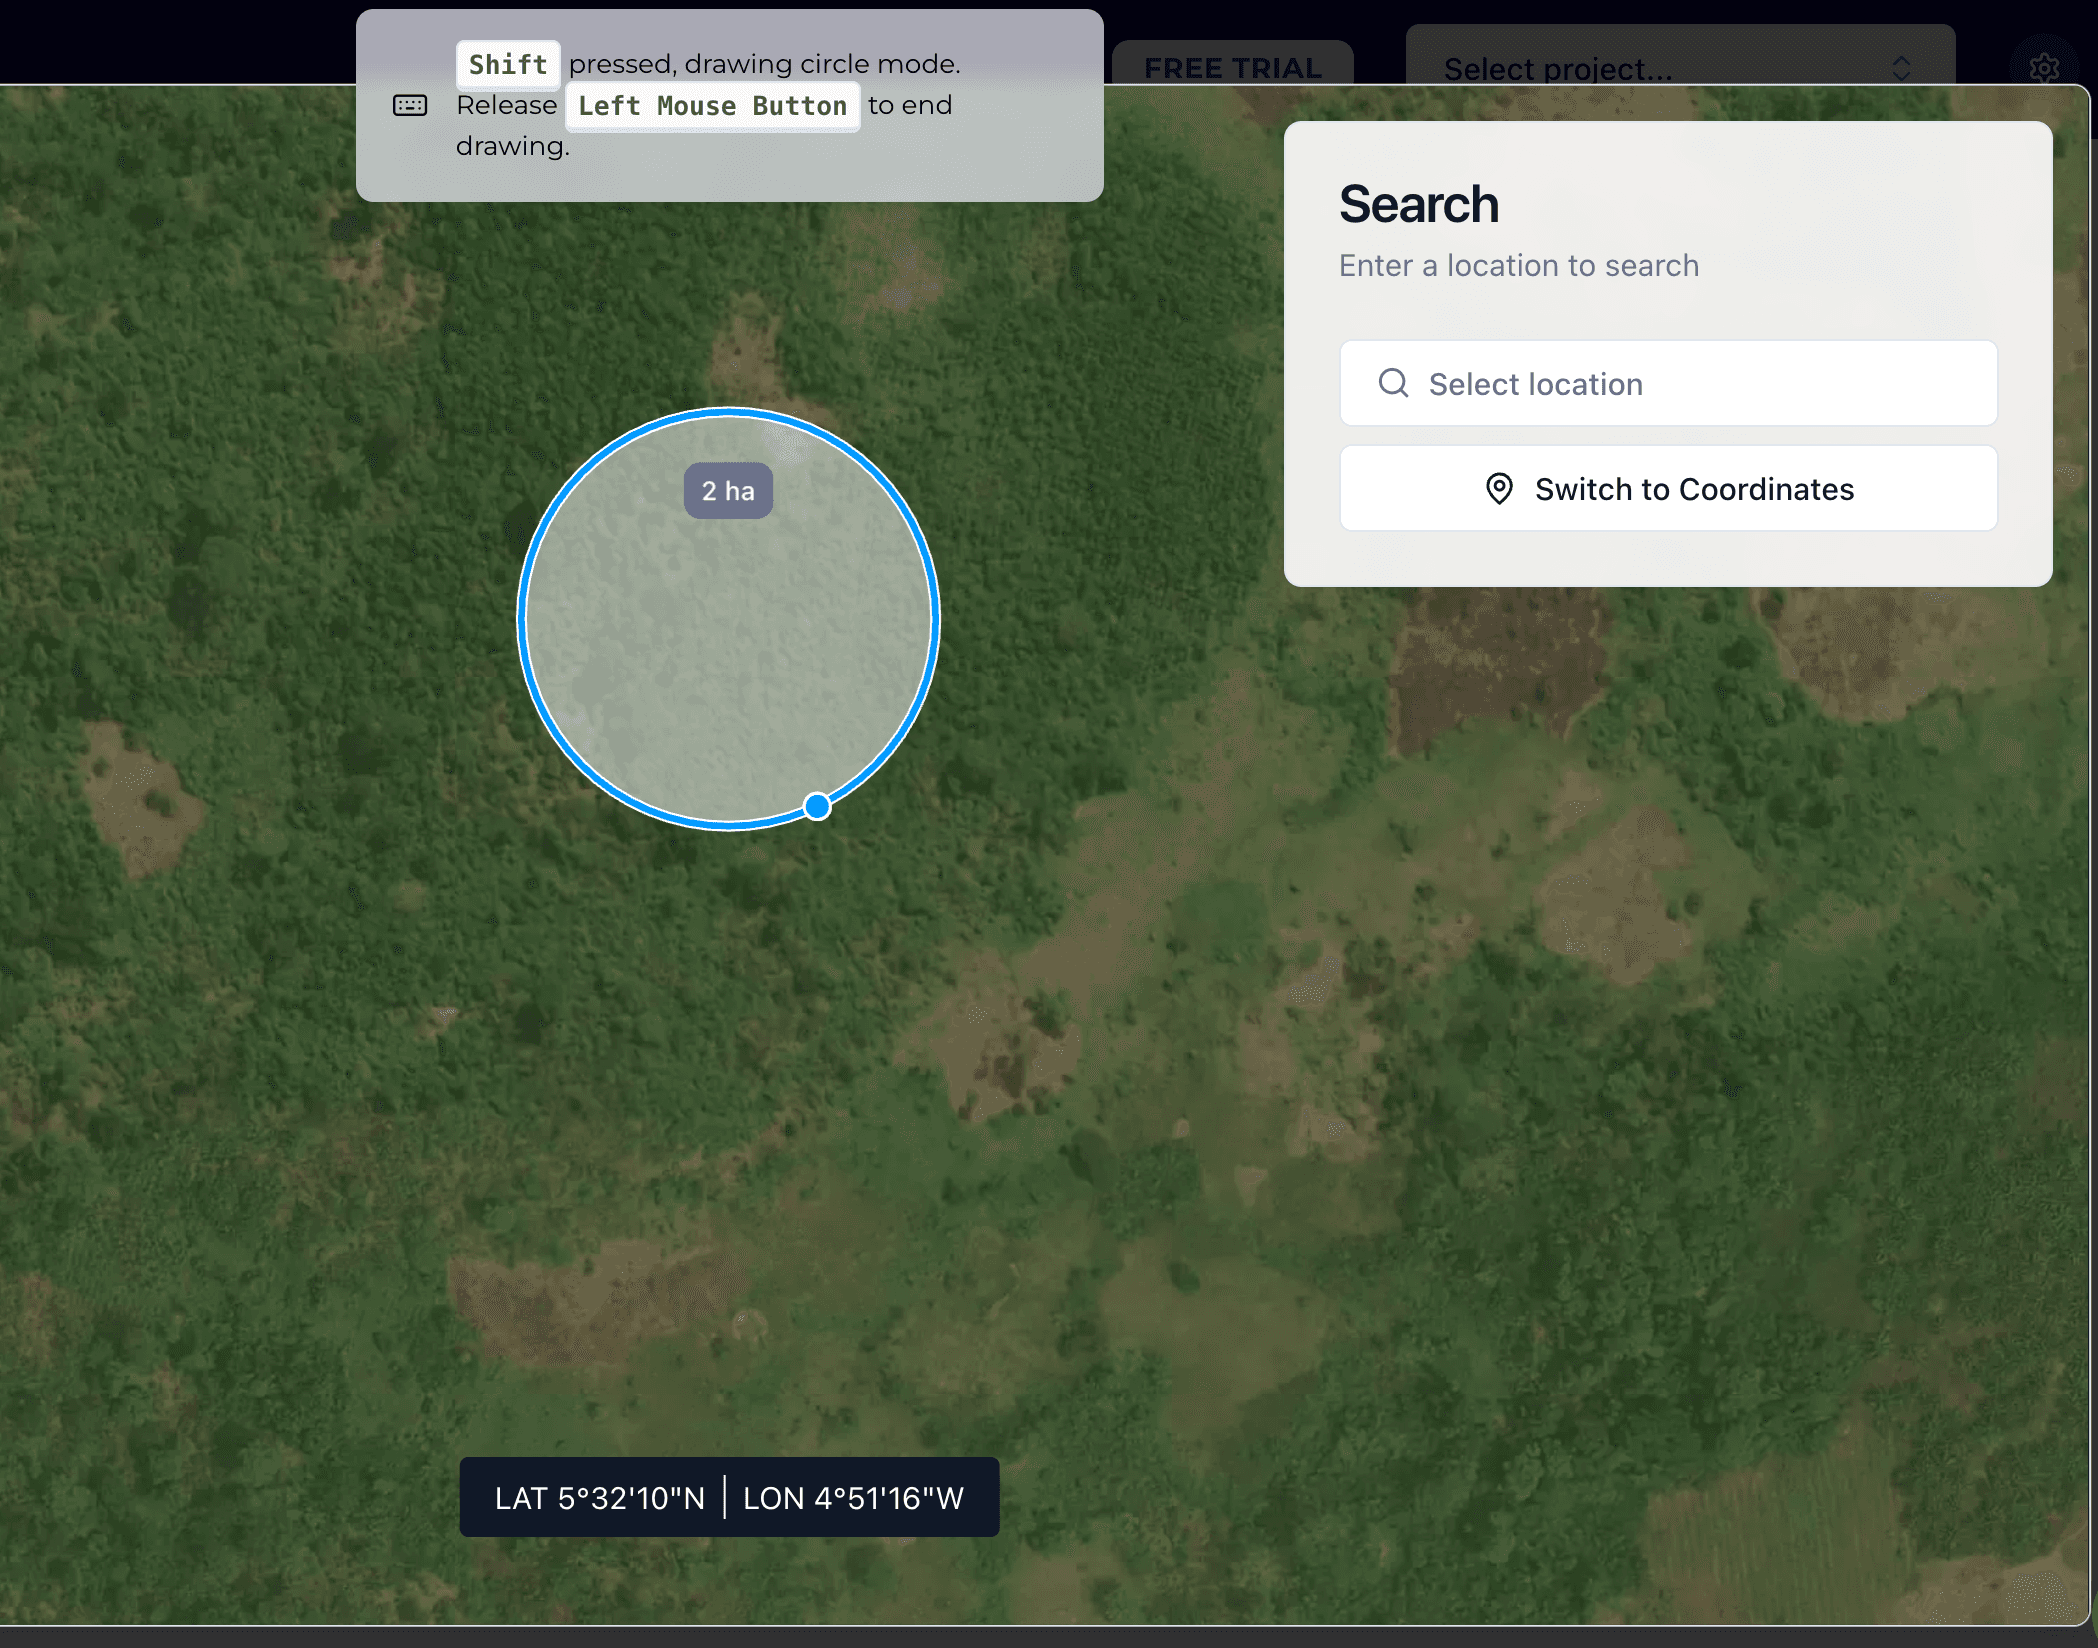
Circle Drawing Around Points - users can easily draw circular areas around specific point locations, offering a new level of spatial precision for defining project areas,
Location Search on Map - In addition to drawing geometries, we’ve introduced a location search feature, enabling users to quickly find specific locations on the map to streamline the project setup process.
The point based geometries are already supported by the project creation API.
Minor improvements
Improvements
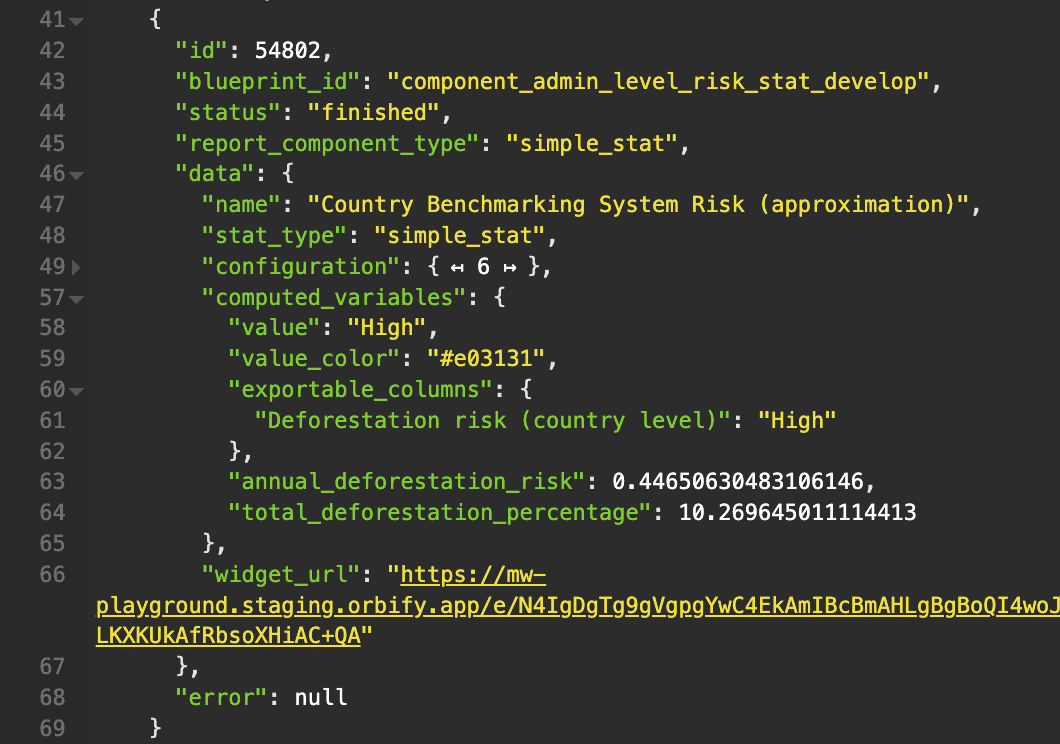
We have extended the API response for Country Benchmarking System Risk to now include the
total_deforestation_percentageproperty
Fixes
Improve perimeter boundary deforestation and degradation component handling of cases with no available data
Fix Mangrove median canopy height calculation for complex scenarios
Correct Soil Texture Chart component's category handling
Fix elevation calculation in Terrain component for very small project areas